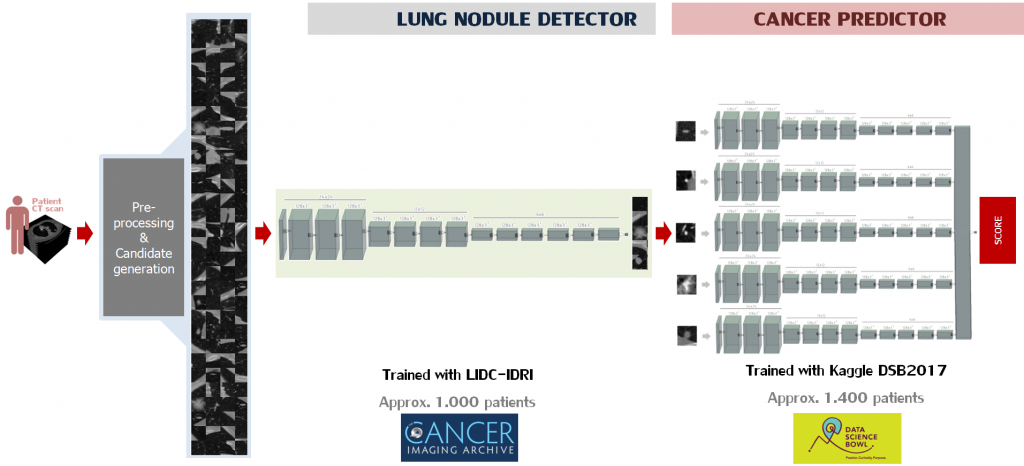
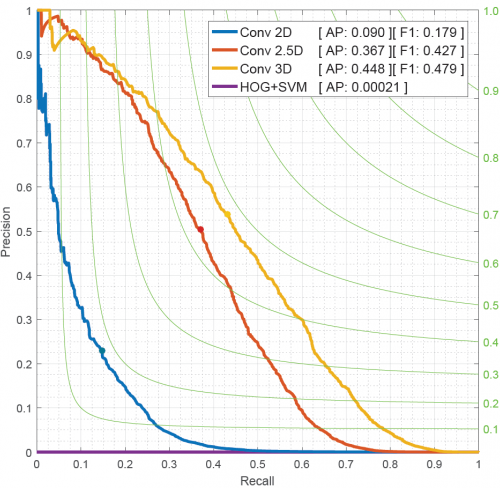
AUTOMATED LUNG CANCER DIAGNOSIS USING THREE-DIMENSIONAL CONVOLUTIONAL NEURAL NETWORKS
Abstract
Method
Results
METHOD
AP (%)
No FP reduction method HOG + SVM CNN 2D CNN 2.5D CNN 3D
0.0062 0.021 8.9 36.7 44.8
Table 1. Average precision obtained with different false positive reduction methods of the nodule detector.
METHOD
AUC ROC (%)
Validation set 5-way Siamese cancer predictor + 3D mask subtraction (X = 0.82) Test set 5-way Siamese cancer predictor + 3D mask subtraction (X = 0.82)
91.5
91.3*
Table 2. AUC of the ROC curve obtained on the validation and test set with and without post-processing. * ISBI 2018 lung cancer challenge results can be found here.
Figure 2. Comparison between false positive reduction methods. HOG+SVM and best networks using convolutions in 2D, 2.5D (2D convolutions over 3D candidates) and 3D.